The demo is a real compilation (open government data plus a fictitious exploration program) in the Basic viewer. Everything below works the same on your own maps. Prefer to be shown? Open the demo with the guided tour: it highlights each button in turn.
1. Open it
Open the demo. A one-time check confirms you are a person (no sign-up), then the map opens. The Tour button at the top restarts the guided tour at any time.
Every map has three viewers, and the menu beside the map's name (it says Basic viewer ▾ here) switches between them at the same place, with a green tick on the one you are in: the Basic viewer (simple and fast, with 3D terrain), the Advanced viewer (the full GIS viewer: identify, measure, print, search) and, on maps with drilling, Underground 3D. Ask the map works in all three.
2. Switch layers on and off
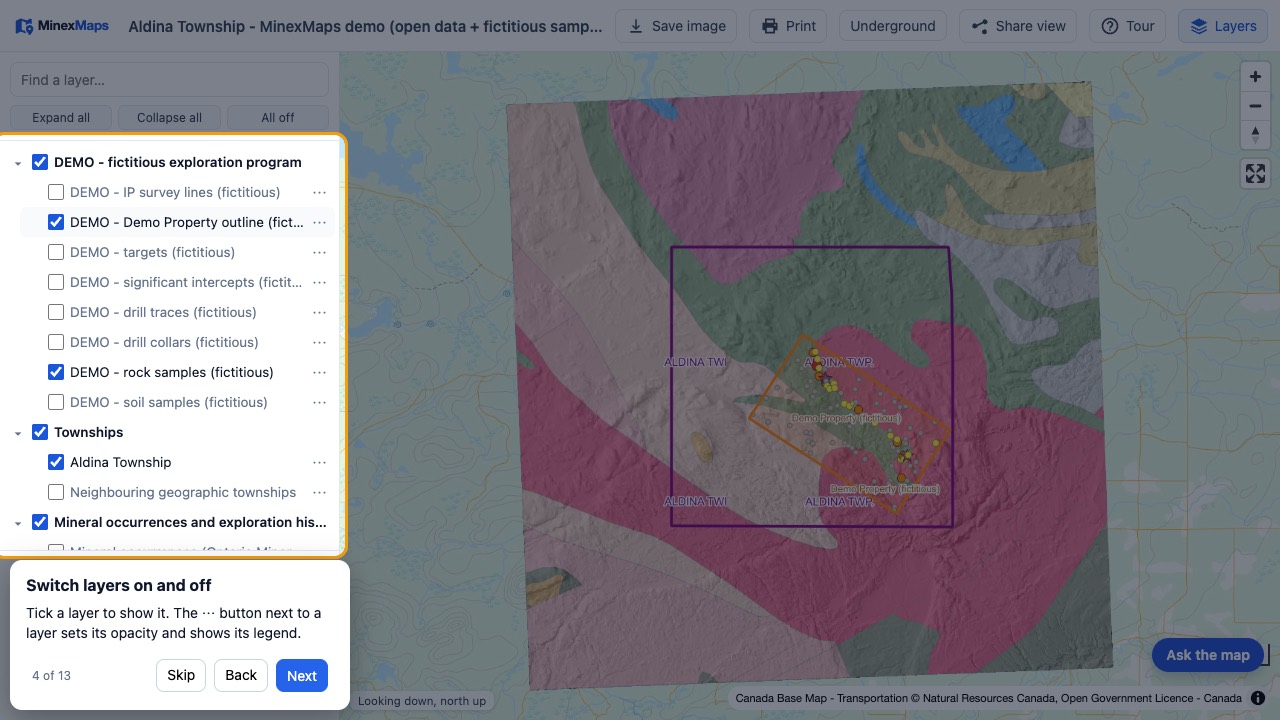
- Layers (top right) opens and closes the list. Tick a layer to show it; the ··· button sets its opacity, shows its legend, switches its labels off and on (when it has labels) and shows the notes about the layer (an i beside the name means it has notes).
- Find a layer filters the list by name, e.g.
magordrill. - Click anything on the map (a sample, a claim, a drill collar) to read its data.
3. Ask the map
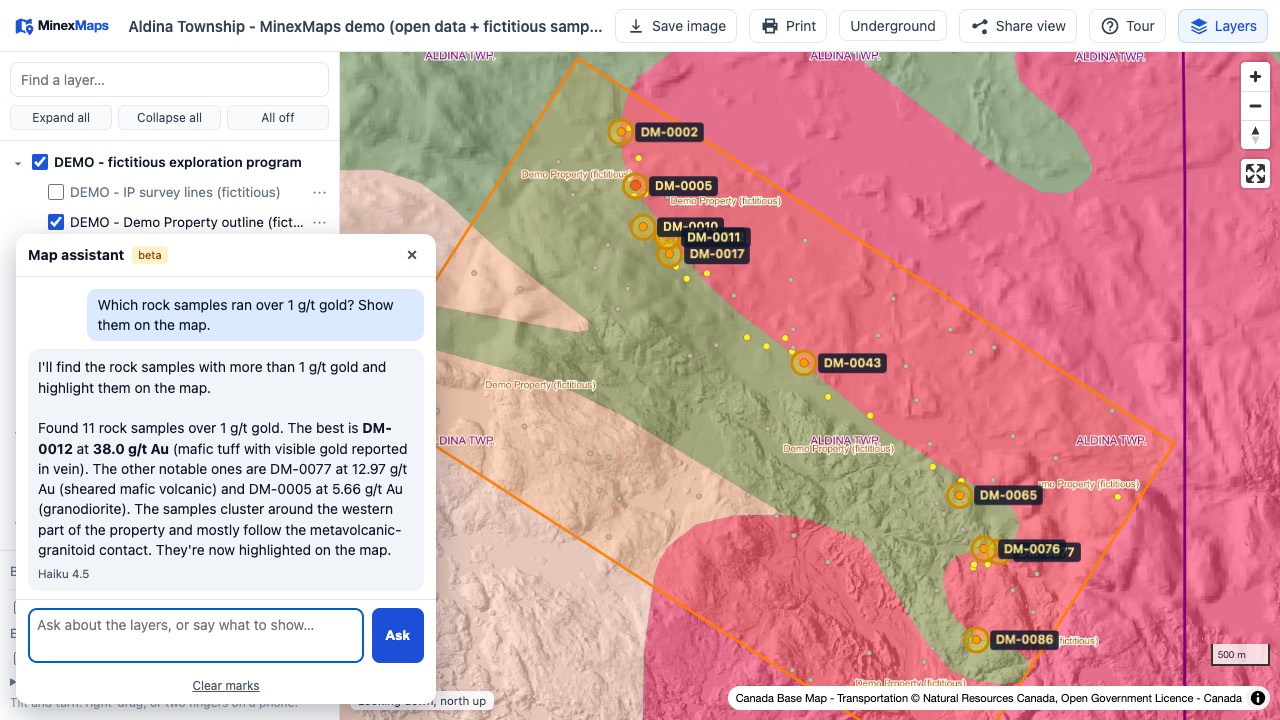
- Press Ask the map (bottom right; bottom left in the Advanced viewer and Underground 3D) and type a question in plain English.
- Try: "Which rock samples ran over 1 g/t gold? Show them on the map.", "What is the tilt derivative for?", "Turn on the magnetics and switch to 3D."
- It reads the layers and their tables, answers with the numbers, highlights the rows and zooms to them. It only talks about the map, and visitors have a few questions an hour.
4. 3D terrain
- At the bottom of the layer list, tick 3D terrain, raise Exaggeration, and tick Hillshade.
- Right-drag to tilt and turn (two fingers on a phone). The compass resets north.
5. The drilling underground
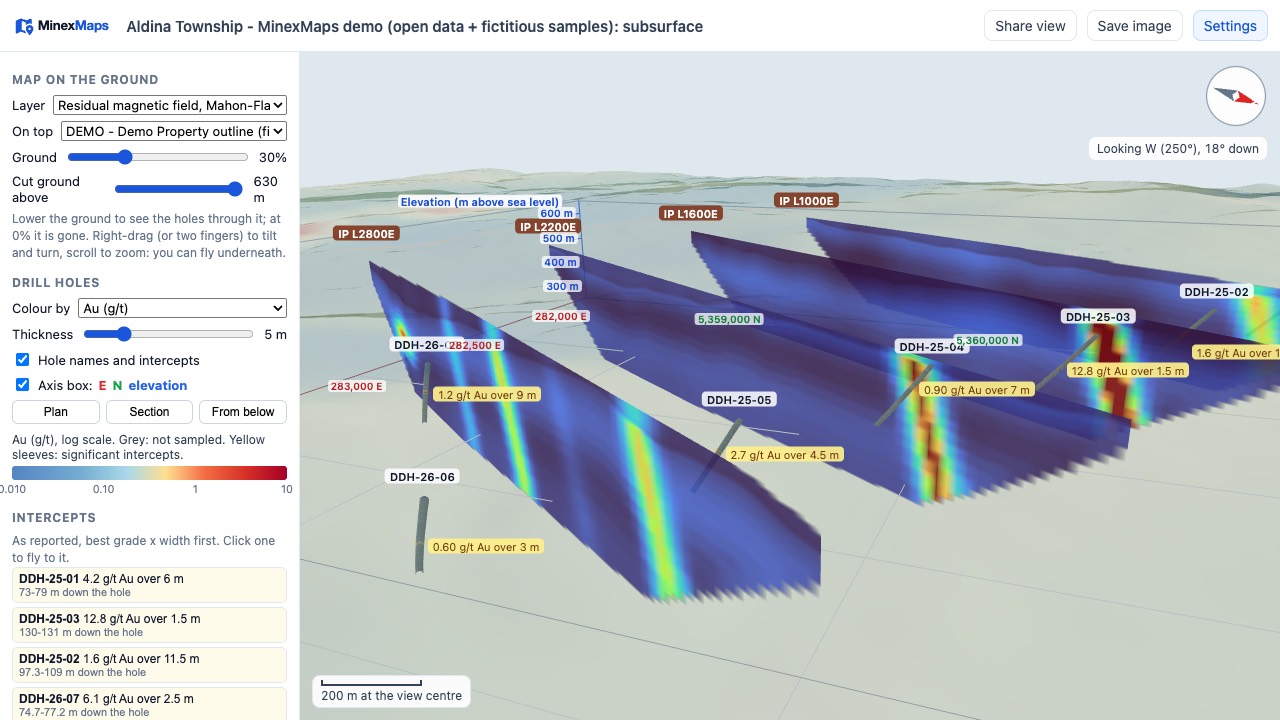
- Or press Section (top), click two points on the map for a section line, choose how wide, and Open section: the 3D view opens with that cross-section already drawn.
- Choose Underground 3D in the viewer menu (top). The holes appear below see-through ground, coloured by grade, with the intercepts labelled as reported. Under Drill holes you can switch hole names and intercept labels on and off separately, and drag the two handles on the grade legend to choose which grades are coloured (the rest of each hole becomes a faint outline). Drag the left handle up to show only the better grades. The Intercepts list has a tick box per intercept to show or hide its label and its yellow sleeve (None clears them all, All brings them back). Intercept sleeves turns every yellow sleeve off; Including zones shows each intercept's higher-grade inner part (“incl. 1.39% Cu over 18.35 m”) in orange-red with its own label. Under Holes, untick a hole (or search, then None) to leave only a faint outline of it. Share view keeps all of these.
- Ground fades the surface; Cut ground above removes it above an elevation; Plan, Section and From below are the standard views; the axis box shows eastings, northings and elevation.
- The small (i) buttons beside the headings and controls explain what each thing is, how to read it and how it was made (hover, or click or tap; Escape closes). Drag the right edge of the settings panel to make it wider (double-click the edge to put it back). With IP or RDI sections, the Lines list has a tick per survey line, a search box and All / None; Share view keeps the lines you picked.
- Depth: move Level to look at one slice of the ground (choose 10 to 100 m thick): only the holes, intercepts and models inside it show, and the panel says how high above sea level and how deep below the surface it is. It is clearest in Plan view. Off shows everything again.
- Ask the map works here too: "Which hole has the best gold intercept? Fly there.", "Colour by copper", "Plan view at 300 m", "Hide the IP sections". It moves the camera to the hole, marks holes or intercepts in yellow, and sets Colour by, Depth, the view and what is shown.
- The viewer menu (top, Underground 3D ▾) goes back to the Basic or Advanced viewer, at the same place. On a phone, Share view and Save image are under More.
- On a phone, the settings open with Settings (top) from the bottom of the screen and close with Close; the 3D view above them still turns with one finger and zooms with two. Tap a hole to see its depth and assays on a card; tap the card to close it.
- The Intercepts list (left) is sorted by grade × width: click one to fly to it.
- The demo also has example 3D models (grade shells at 0.3, 1 and 3 g/t gold, one inside the other around the better intercepts, splay lenses and a cross fault), invented for illustration like its drill holes: switch them on under 3D models. On your own maps, this is where your Leapfrog models appear, and block models (resistivity, susceptibility, grades) under Voxels: tick one, then drag the handles on its colour bar to show only the cells between them (hover a cell for its value).
- Cross-section: choose Draw a section line and click two points (Plan view is easiest), or pick a hole to cut along it, and how far either side to look. A true-scale section opens below the 3D view: the holes in that slab coloured by grade, their intercepts, the ground surface and any 3D models it cuts. Save image on the section saves it as a picture.
- Plan holes (top; under More on a phone) opens a separate drill planning panel: add conductor plates from an EM model, paint a voxel target, draw faults, and propose holes (click the collar on the ground, or aim at a plate or target and the azimuth, dip and length are worked out). Each hole shows where it meets every plate, fault and target, the depth to its target and a warning if it misses or crosses a fault first, with a hole table and the metres in total. It is a planning sketch, not data: it stays in your browser, in the plan file you save and in a share link, unless you save it to the map (Saved plans, signed in): a plan from someone who is not the map’s admin or editor goes to them for approval first, and approved plans are shown to everyone who can open the map.
- In the drill planning panel, Import plates (Maxwell, CSV) brings in conductor plates from a Maxwell plate file or a plate table (choose which column is which, and whether x, y, z is the plate's top centre or its centre), and Import block model (CSV) brings in the blocks at or above a cut-off grade, coloured by grade (up to 50,000). A hole can curve: type its lift and drift (degrees per 100 m) and Aim at bends it onto the target; Surveys CSV gives the driller depth, azimuth, dip and coordinates down every hole. Proposed holes, plates, faults and blocks also show on the cross-section. Files are read in your browser; nothing is uploaded.
- Plan holes (top; under More on a phone) opens a separate drill planning panel: add conductor plates from an EM model, paint a voxel target, draw faults, and propose holes (click the collar on the ground, or aim at a plate or target and the azimuth, dip and length are worked out). Each hole shows where it meets every plate, fault and target, the depth to its target and a warning if it misses or crosses a fault first, with a hole table and the metres in total. It is a planning sketch, not data: it stays in your browser, in the plan file you save and in a share link (Save, load and share, at the bottom of the panel).
- A target point goes where you click: on a plate (even seen edge-on), a voxel block, a hole or the level. Snap target to chooses a plate's surface or centre, a block's centre or the level instead. Drag its red, green and blue arrows to move it east, north or up and down, or type its easting, northing and elevation: the hole re-aims as it moves.
- Holes start 2 m thick (the Thickness slider changes it); Collar symbols under Drill holes switches the ring at the top of each hole; the interpretation sketches have their own Labels on the view switch. Hover any button or box to see what it does.
6. Share what you see
Share view copies a link that opens exactly this view (layers, zoom, 3D angle). Save image saves a picture for a slide or an email.
Stuck? Contact us and we will help.